![ee23019e-2bd8-4fbb-b8e4-1a90b019163c-2.webp]](https://learn.eventpipe.com/hs-fs/hubfs/ee23019e-2bd8-4fbb-b8e4-1a90b019163c-2.webp?height=40&name=ee23019e-2bd8-4fbb-b8e4-1a90b019163c-2.webp)
The Event Producer Dashboard answers two separate questions about your event:
-
How is housing performing? — how many rooms and room nights have been booked, where guests are coming from, which hotels and brands are absorbing the demand, and what inventory is still available.
-
Are my teams compliant? — which teams have met your stay-to-play requirement, which still have work to do, and who to contact about it.
To get started, select an event from the dropdown....
Top-line KPIs
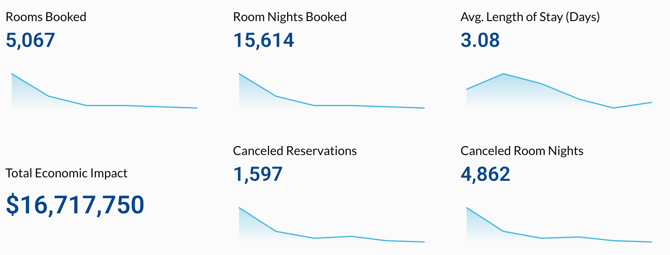
These are room nights reported in EventPipe and not actualized nights (data reported back from the hotel post-event through reconciliation)
|
Metric |
What it counts |
Notes |
|---|---|---|
|
Rooms Booked |
One count per reservation record |
Each reservation equals one room. A team booking 12 rooms shows as 12. |
|
Room Nights Booked |
Sum of room nights across all reservations |
Rooms × nights. This is the number most hotel contracts and pickup reports are measured against. |
|
Avg. Length of Stay (Days) |
Average room nights per reservation, trended by the month the reservation was created |
Watch the trend, not just the number — a falling average late in the booking window usually means shoulder-night drop-off. |
|
Total Economic Impact |
Room Nights × $256.25 × 4 |
A modeled estimate, not actual dollars collected. See the caution below. |
|
Cancelled Reservations |
Count of canceled reservations, trended by month created |
|
|
Cancelled Room Nights |
Room nights attached to those cancellations |
Compare against Room Nights Booked for an effective cancellation rate. |
Caution on Total Economic Impact. This figure multiplies room nights by a fixed daily visitor spend assumption ($256.25) and a fixed party-size assumption (4). It is designed for CVB conversations, sponsor decks, and destination advocacy. It is not revenue, and it will not tie to any invoice, rebate, or hotel folio. Present it as an economic impact estimate and state the assumptions when you use it externally.
Room Nights by Hotel Brand / Booking Value by Hotel Brand
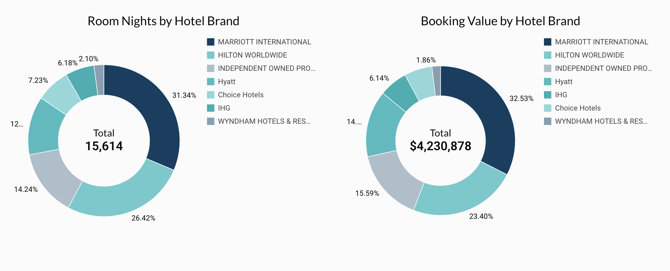
Two brand-level views of the same demand:
-
Room Nights by Hotel Brand — volume. Useful for showing a brand partner how much business the event delivered.
-
Booking Value by Hotel Brand — sums the total reservation rate and displays each brand's share of the grand total. Useful for rate-mix conversations: a brand can be a small share of room nights but a large share of value, or vice versa.
Hotel Availability
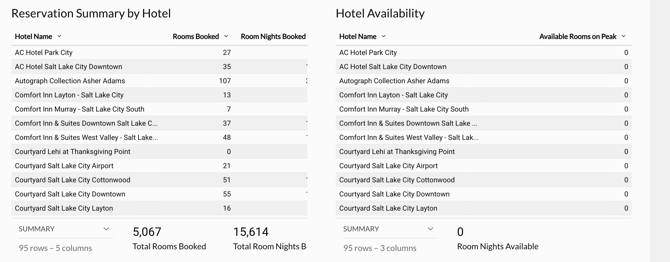
Reservation Summary by Hotel - Property-level detail: Hotel Name with Rooms Booked and Room Nights Booked, plus totals. This is your working pickup view - the one to export before a hotel call.
Hotel Availability - Shows remaining Available Rooms on Peak by hotel. This is the single most misread element on the dashboard, so read the rule carefully:
Availability is forced to zero for any hotel whose cutoff date has passed or whose event hotel status is not LIVE.
That means a hotel with 40 physical rooms left in its block will display 0 once the cutoff date passes. A hotel dropping to zero overnight is usually a cutoff event, not a sellout. Before you report a property as sold out, confirm its cutoff date and status.
Guest State and "Where are my guests coming from?"
-
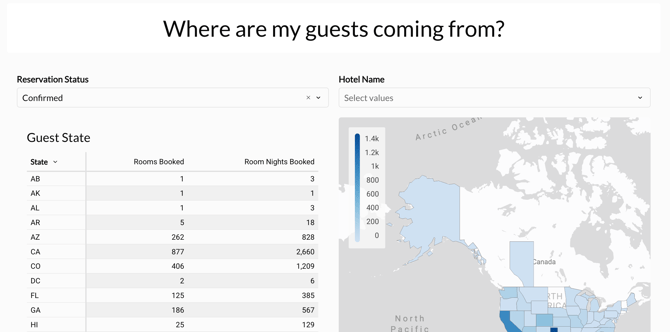
Guest State is a pivot table of Rooms Booked and Room Nights Booked by state, with grand totals.
-
Where are my guests coming from? is the map version of the same breakdown.
Use these for travel-radius arguments in destination pitches, and to sanity-check compliance: a heavy in-state concentration often correlates with a large Local exemption pool.
Section 2 — Team compliance
Compliance statuses
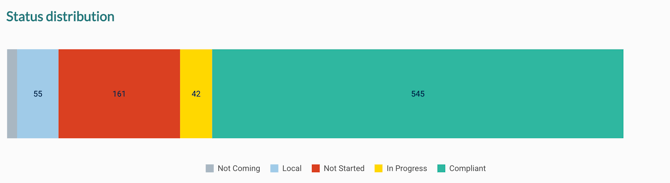
Every team carries one of seven statuses:
|
Status |
Meaning |
|---|---|
|
Compliant |
Requirement met |
|
In Progress |
Has booked, but has not yet met the requirement |
|
Not Started |
Attending, no qualifying bookings yet |
|
Previously Compliant |
Was compliant, then fell below the threshold (typically a cancellation) |
|
Exempt |
Excused from the requirement |
|
Local |
Within the local radius, requirement does not apply |
|
Not Coming |
Withdrawn or not attending |
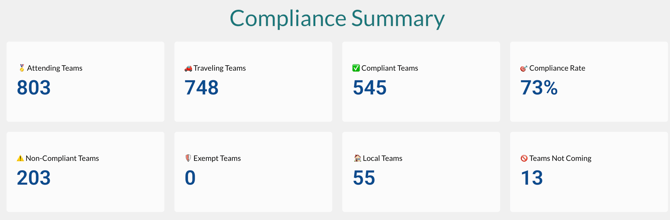
The team-count KPIs
Each tile counts teams, and each uses a different slice of the statuses above. This is where most misreadings happen, so the exact definitions:
|
Tile |
Includes |
|---|---|
|
🏅 Attending Teams |
Everything except Not Coming |
|
🚗 Traveling Teams |
Compliant + In Progress + Not Started + Previously Compliant (attending, and neither Local nor Exempt) |
|
✅ Compliant Teams |
Compliant only |
|
⚠️ Non-Compliant Teams |
In Progress + Not Started + Previously Compliant |
|
🛡️ Exempt Teams |
Exempt only |
|
🏠 Local Teams |
Local only |
|
🚫 Teams Not Coming |
Not Coming only |